client: Nieuwsuur
Dutch general elections ‘21
Part of a series of analysis videos leading up to the 2023 Dutch national elections, each focusing on a key political issue.
For this episode on the housing crisis, I translated data research into visuals. Colleague journalists analysed parliamentary motions and how each party voted, and I turned their findings into a heatmap, both as a physical set pieces and animated overlays, to highlight key insights. By combining tangible visuals with motion design, I helped make complex political data clear and engaging for viewers.
Adobe Illustrator | After Effects
excerpts in which my work can be seen
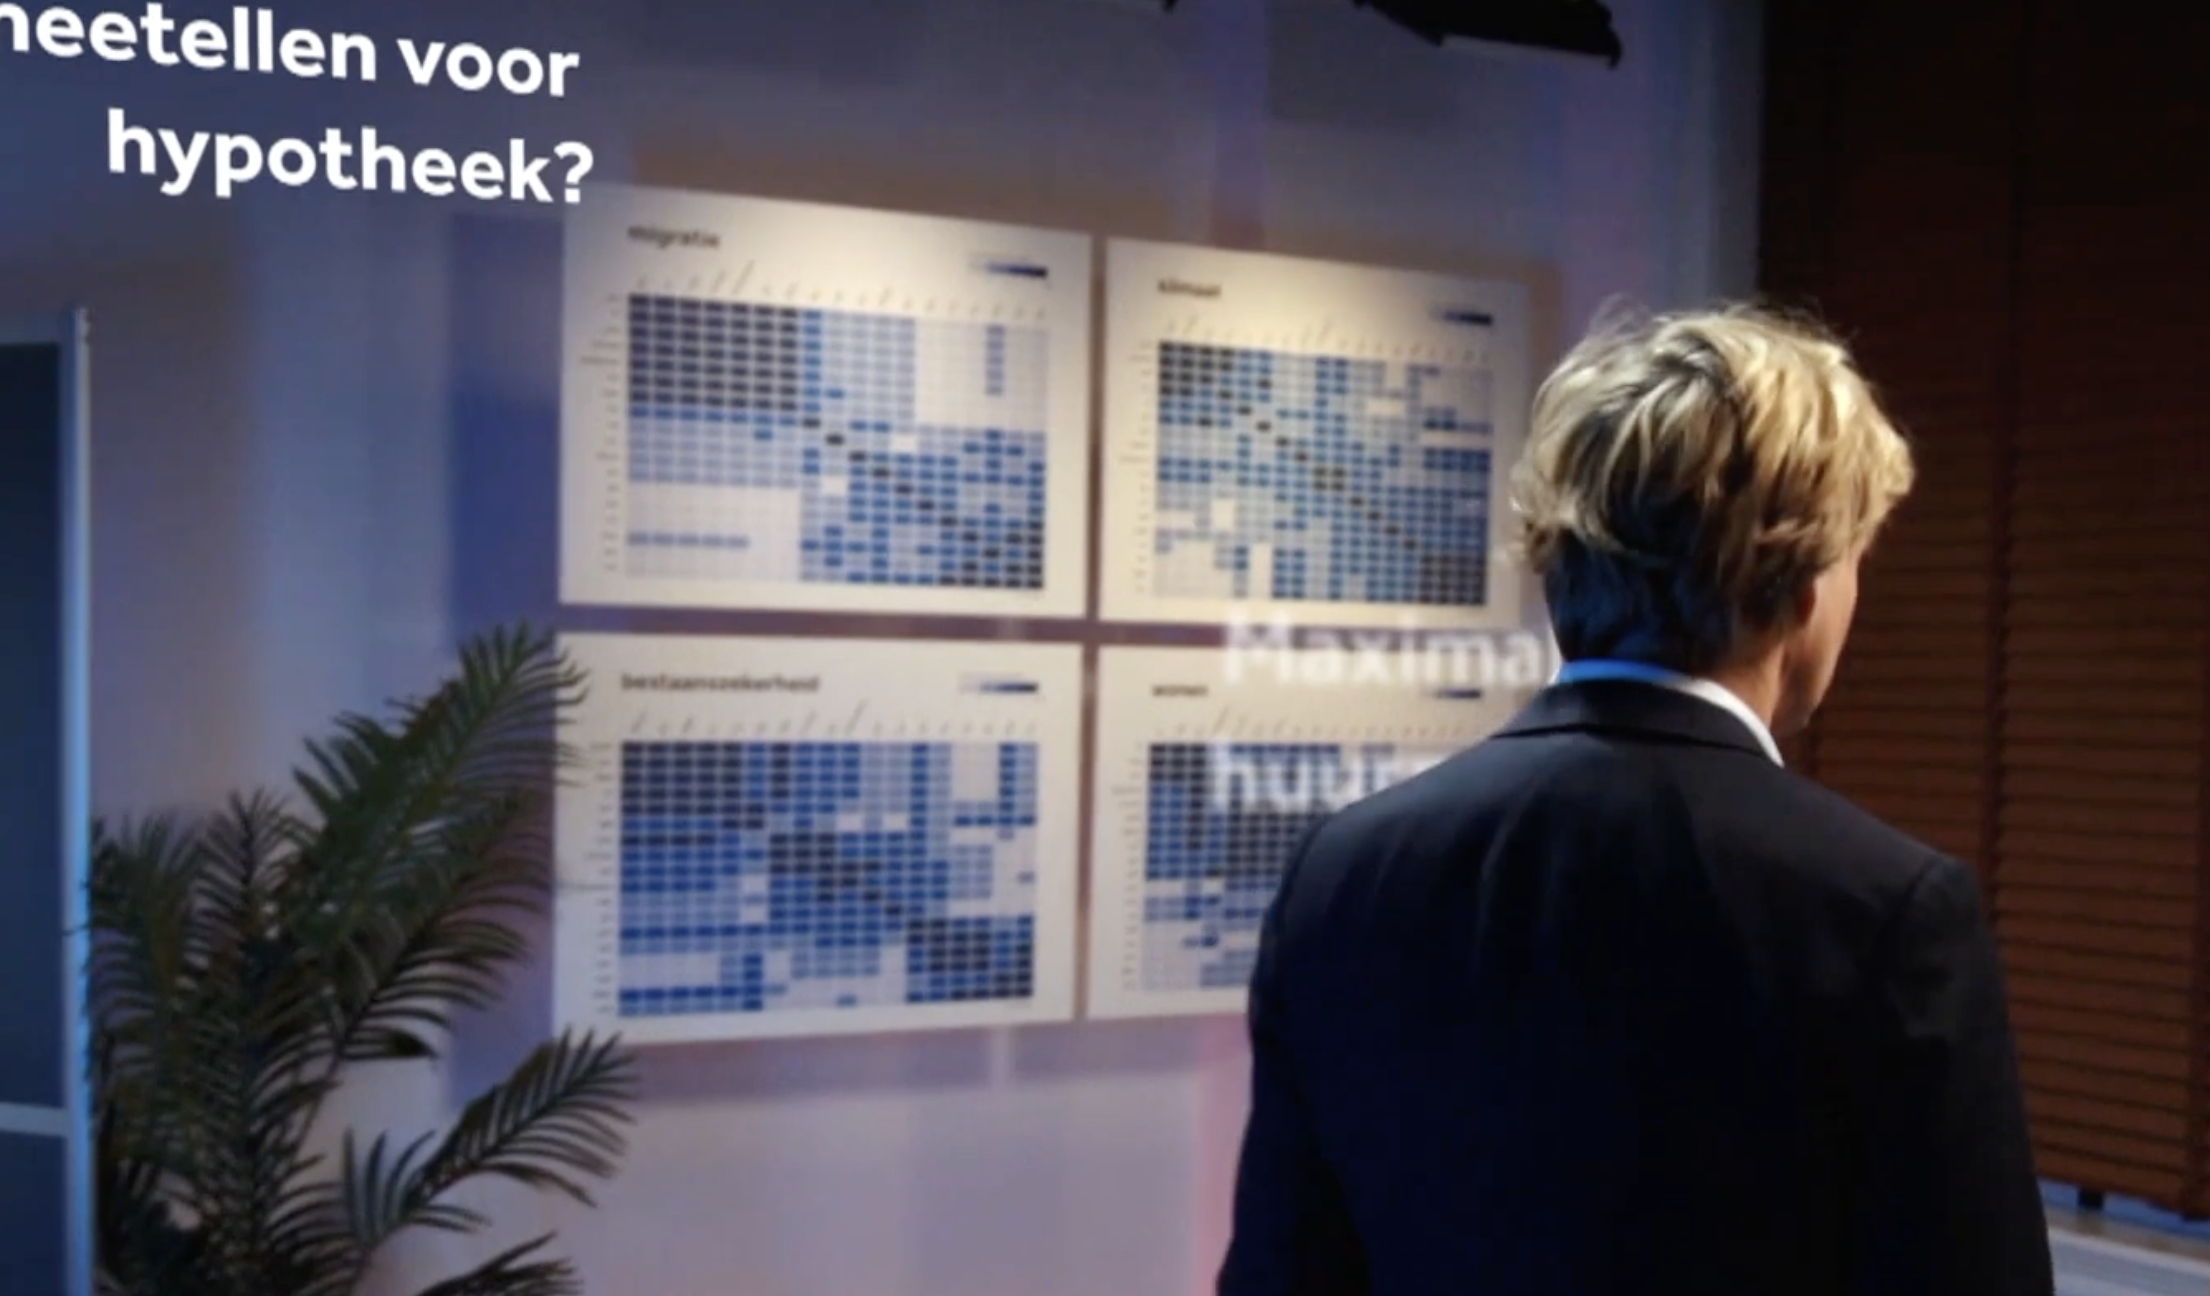
motion tracking and printed heat maps
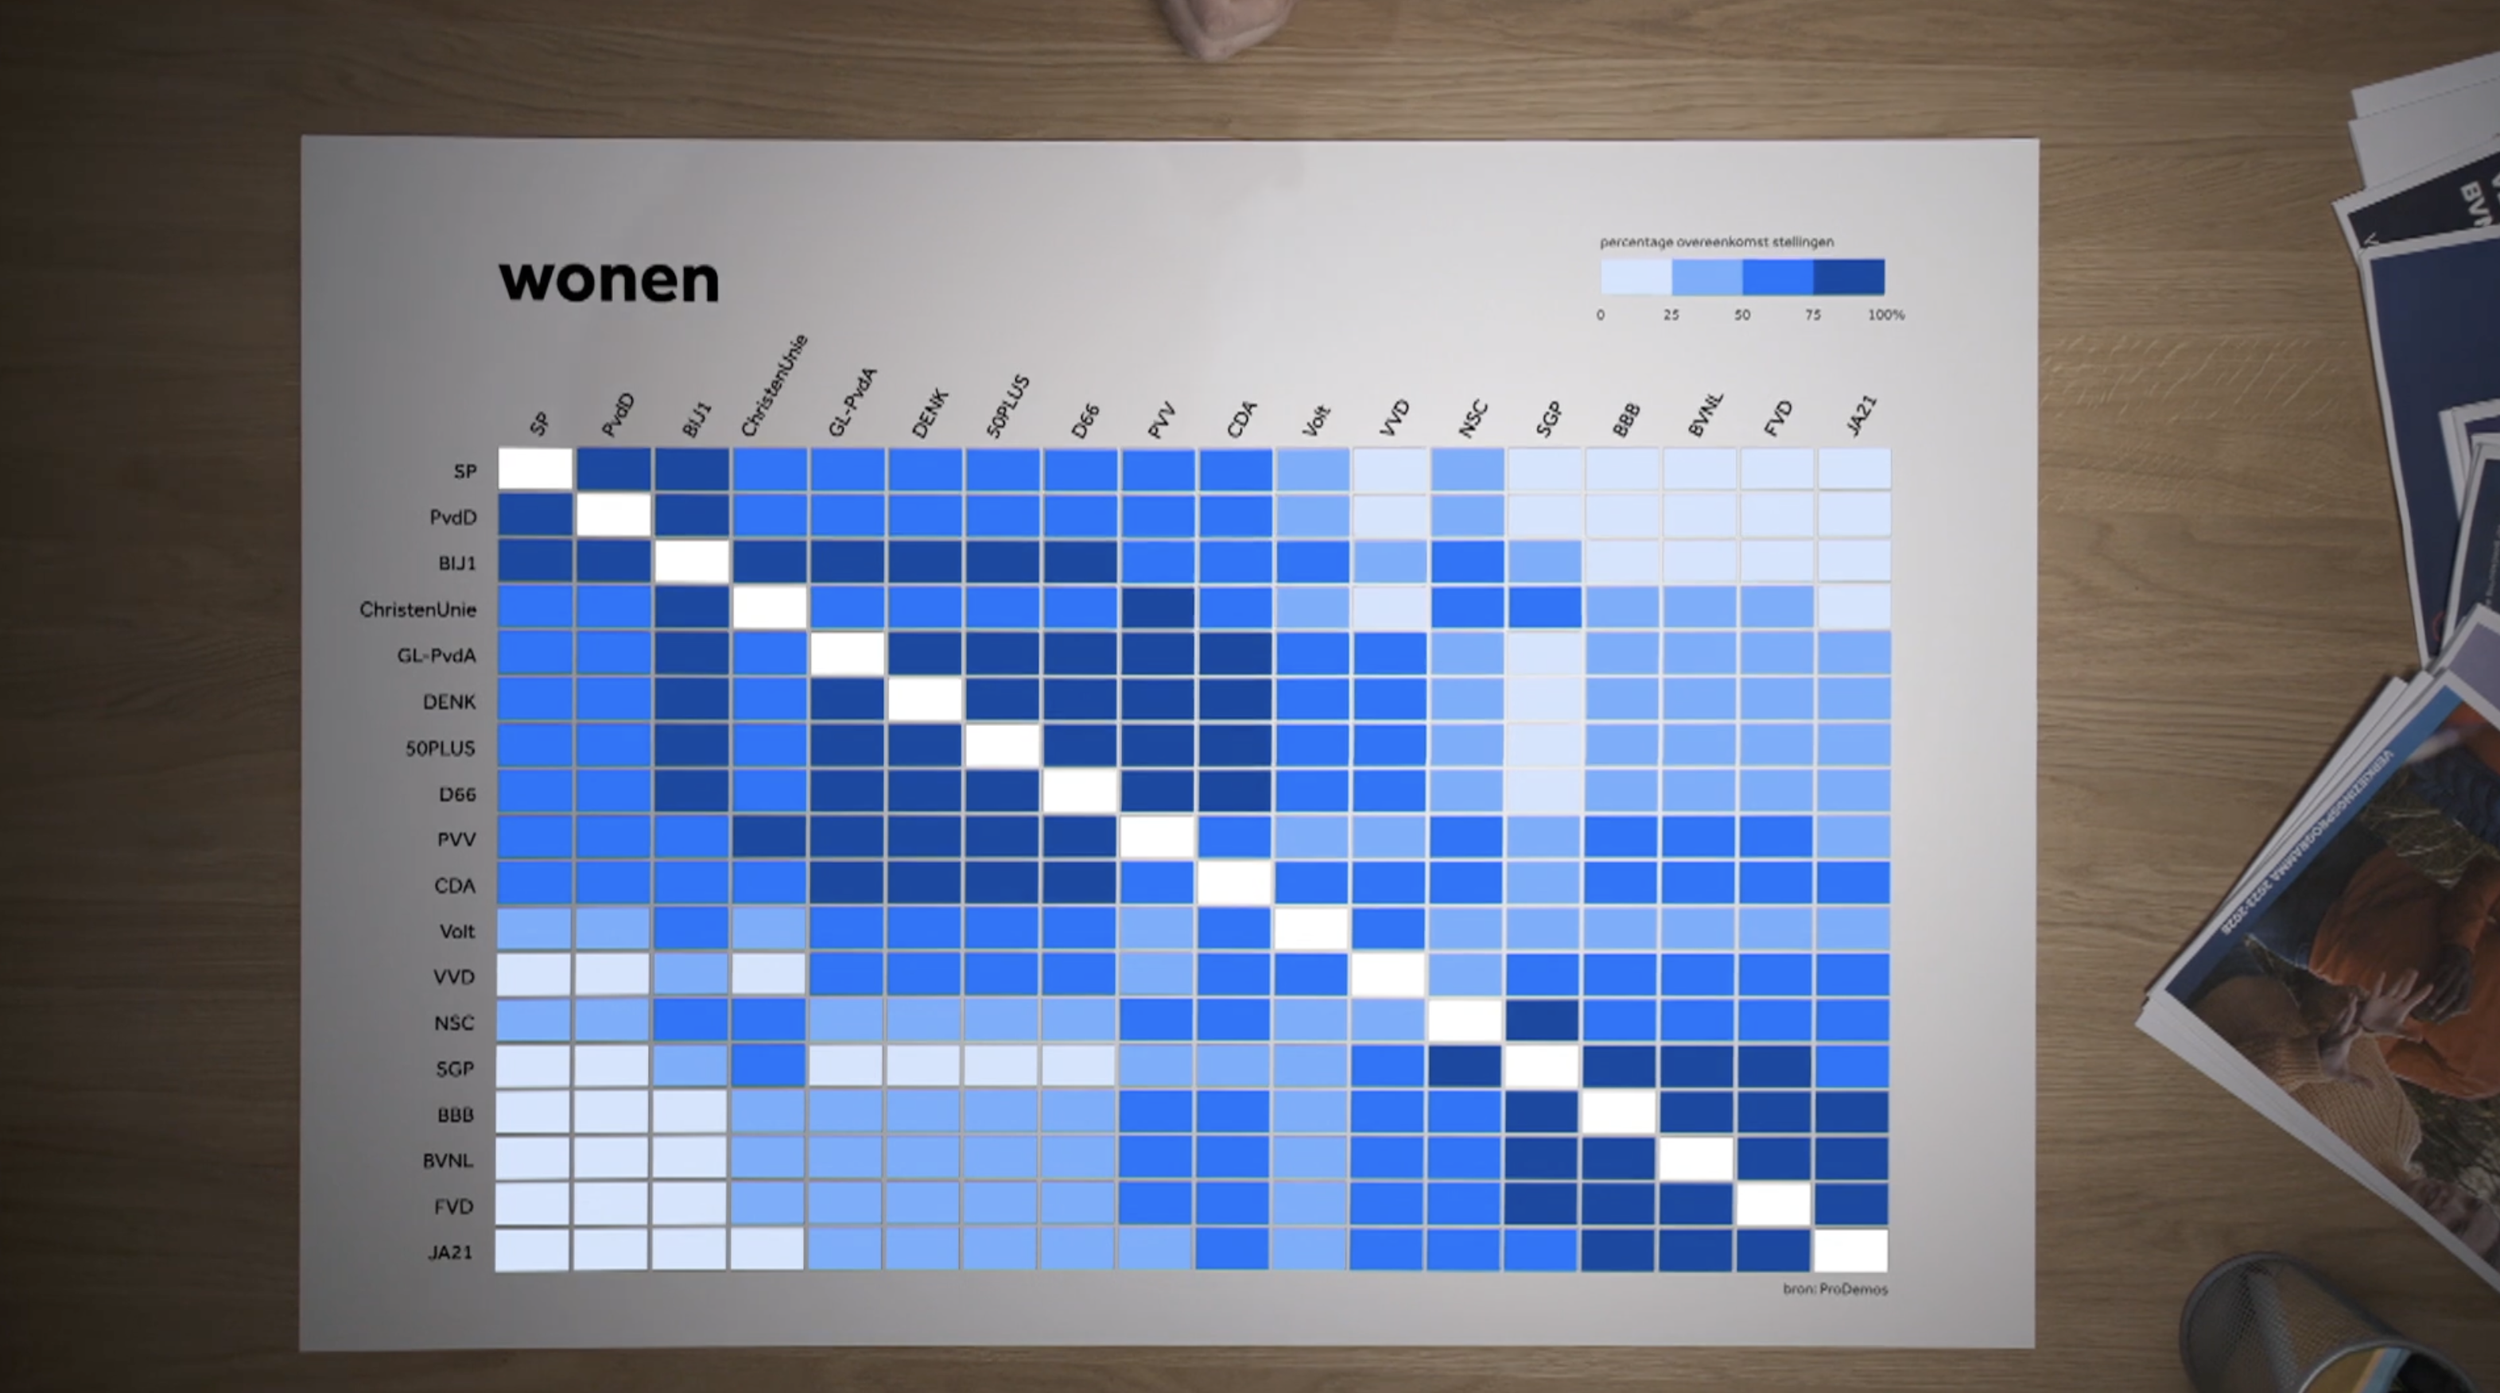
animated heat map depicting the voting behavior about housing by the political parties
watch the full video below